
Gantt charts are one of the most widely used tools in project management, helping teams visualize project timelines, track progress, and manage resources efficiently. While they may seem straightforward at first glance, understanding the technical terms associated with Gantt charts is crucial for effective project execution.
Key Gantt Chart Components & Their Role in Project Management
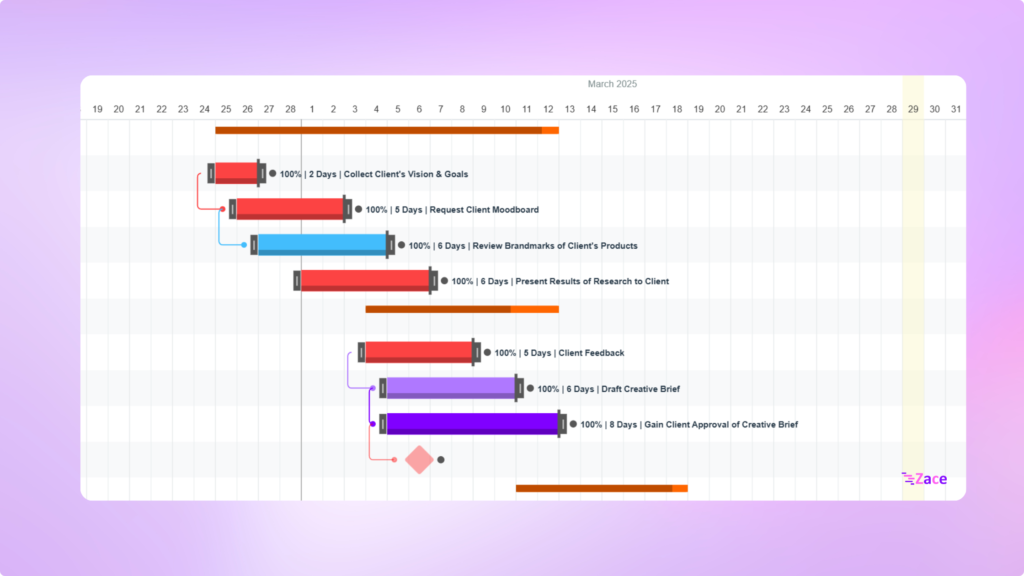
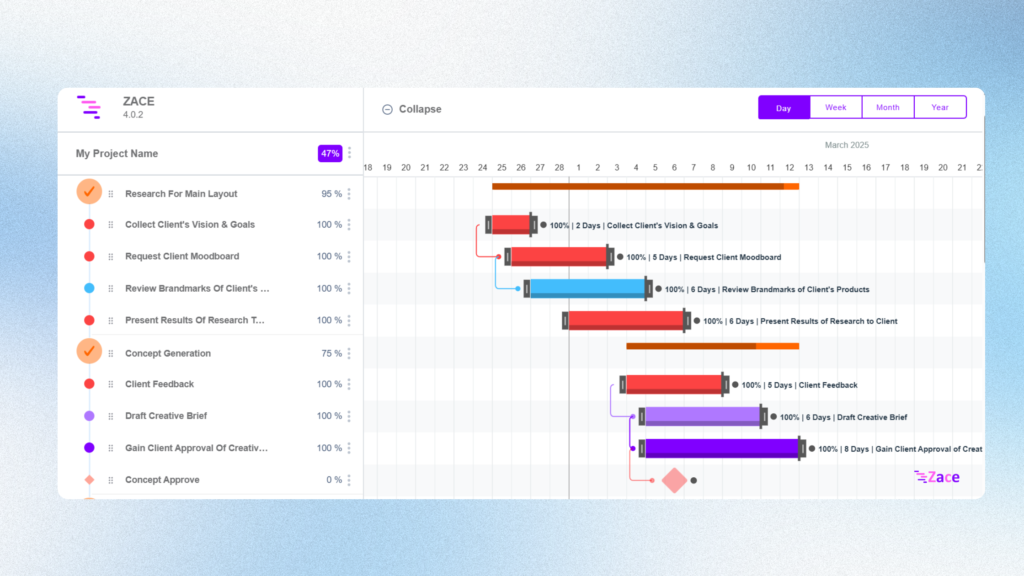
- Task : A task represents a specific activity or work unit that needs to be completed within the project timeline. Each task is assigned a duration and is typically represented as a horizontal bar in the Gantt chart.
- Task Name : A brief description of each task.
- Task Owner : The person who assigns who is responsible for each task.
- Task Priority : Define urgency of the project : High, Medium, Low . Helps in resource allocation and risk management.
- Task Duration : The total time required to complete a task.
- Start Date & End Date : The scheduled dates when a task begins and ends.
- Milestone : A significant event or achievement in the project, usually marked with a diamond symbol.
- Dependencies : Relationships between tasks that determine the order in which they must be completed.
- Predecessor Task : A task that must be completed before another task starts.
- Successor Task : A task that follows another and depends on its completion.
- Lead Time : The amount of time a successor task can start before its predecessor finishes.
- Lag Time: The delay between the completion of one task and the start of the next dependent task.
Dependency Types
Task dependencies define the order in which tasks must be completed in a project. In a Gantt chart, dependencies link tasks together to maintain a logical workflow.
- Finish-to-Start (FS) – The most common dependency where one task must finish before another starts.
- Start-to-Start (SS) – A task can only start when its predecessor starts.
- Finish-to-Finish (FF) – A task can only finish when its predecessor finishes.
- Start-to-Finish (SF) – A task can only finish when its predecessor starts.
Project Scheduling & Adjustments
Project scheduling ensures that tasks are planned, sequenced, and completed on time. Adjustments help accommodate delays, scope changes, or resource constraints.
- Critical Path – The longest sequence of dependent tasks that determines the shortest project duration.
- Slack (Float) – The amount of time a task can be delayed without delaying the project’s completion.
- Baseline – The original project plan used for comparison with actual progress. It helps in tracking deviations from the planned timeline.
- Resource Allocation – The assignment of team members or resources to tasks.
Project Tracking
Project tracking ensures that tasks stay on schedule, resources are used efficiently, and project goals are met. Gantt charts help visualize progress, identify bottlenecks, and make adjustments when needed. The key aspects are in monitoring project progress, identifying delays, tracking resource and budget and making adjustments in real-time.
- Resource Allocation : Resource allocation refers to assigning available resources (team members, equipment, budget) to tasks in a way that optimizes efficiency and avoids bottlenecks.
- Progress Tracking : Progress tracking refers to monitoring the percentage of task completion within the Gantt chart.
- Work Breakdown Structure (WBS) : A work breakdown structure (WBS) divides the project into smaller, manageable sections. The WBS helps in structuring the Gantt chart for better clarity.
Understanding these Gantt chart technical terms can significantly improve project planning and execution. Whether you’re managing software development, marketing campaigns, or construction projects, mastering these concepts will help streamline workflows and enhance productivity. By implementing these terms in your Gantt chart strategy, you can ensure better communication, timely deliveries, and successful project completion.
Looking for the best project management tools to visualize Gantt charts?