Project management involves an interplay of tasks, timelines, and resources. Amidst this landscape, the Gantt chart emerges as a beacon of clarity and organization. Whether you’re a project manager or new, to the field, it’s crucial to grasp the intricacies of a Gantt chart for project planning. In this guide we will delve into the background practical applications, creation process, benefits and more aspects related to the utilization of Gantt charts.
Gantt Chart
A Gantt chart is a visual representation of a project’s schedule, showing tasks, milestones, and dependencies over time. It provides a clear and concise view of the project’s timeline, allowing project managers to plan, coordinate, and track progress with ease.
Gantt charts are tools employed for planning, scheduling and overseeing projects of varying scales. They offer a representation of project timelines that aids teams and stakeholders in progress updates, deadlines, and dependencies within the project. Gantt charts prove effective, in managing projects that involve numerous tasks and interconnected activities.
Named after its creator, Henry L. Gantt, the Gantt chart made its debut in the 1910s. Gantt, an American mechanical engineer and management consultant, designed the chart as a visual aid for scheduling and controlling work in large construction projects. Over the years, Gantt charts have evolved into a staple tool in project management across various industries.
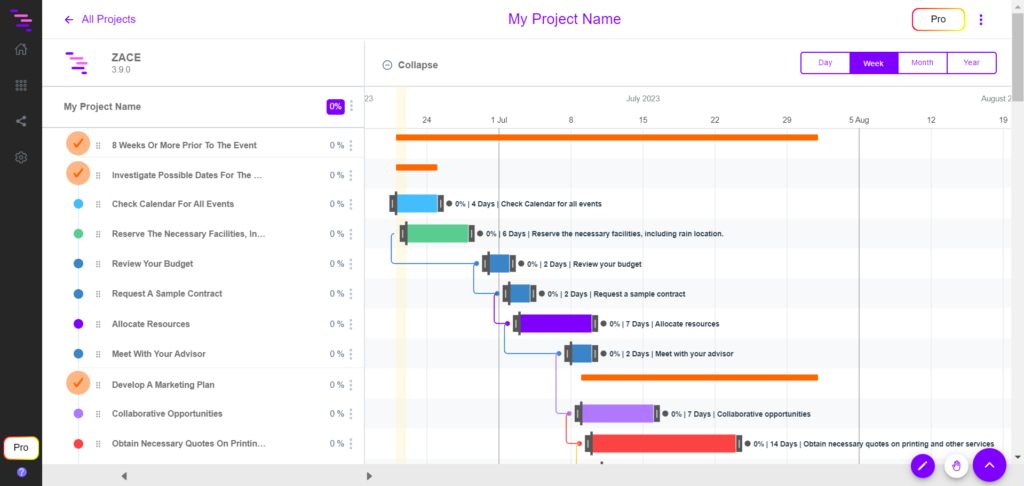
A typical Gantt chart includes :
- Tasks and Sub-tasks: The list of all tasks or activities required for the project.
- Timeline: A horizontal timeline representing the entire project’s duration.
- Bars or Blocks: Bars or blocks representing the duration of each task.
- Dependencies: Arrows or lines connecting tasks to show dependencies and sequencing.
- Milestones: Significant points in the project marked for achievements or deadlines.
How to create a Gantt Chart?
Creating a Gantt chart involves various steps, to detail the project into a plain or new chart.
Project Details : Enter the basic project details, like project name, project timeline, project owner, on how you wish the project is to be saved in Gantt.
Define Tasks : List all the tasks needed to complete the project.
Define sub-tasks : Breakdown the tasks into sub-tasks.
Duration : Estimate and set the timeline required for each task completion.
Task Sequence : Determine the order of tasks and dependencies.
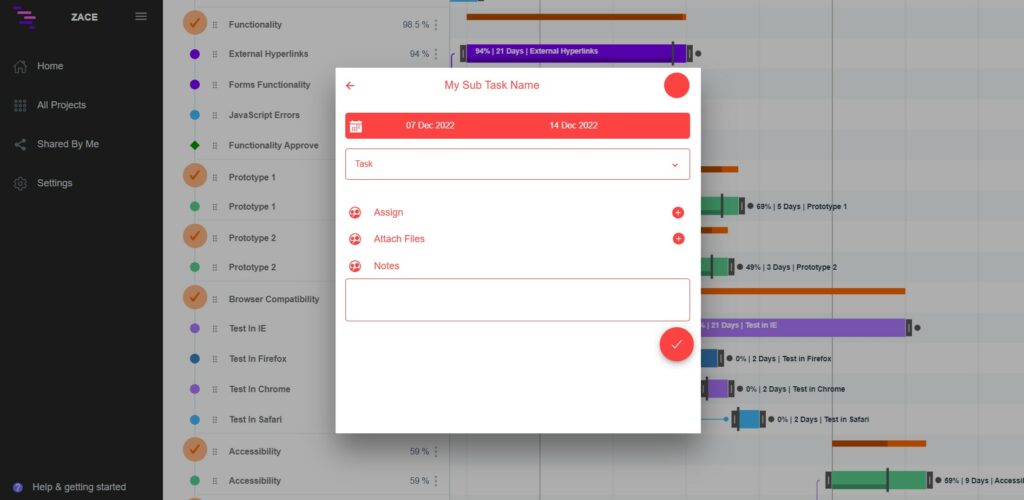
Chart Preparation : With all the unique features available in the software you are using to prepare the Gantt chart, input tasks, durations, and dependencies.
Assign Tasks : Assign the tasks to your team and share the chart with the team. Include notes in the required tasks or sub-tasks.
Share with Clients: Share the chart with clients for transparent communication and effective collaboration.
Adjust and Update: Continuously update the chart as the project progresses, until completion.
Gantt Chart Template
A Gantt chart template is a pre-designed framework that makes it easier and simpler for project managers or team leaders to create Gantt charts. By using templates, you can save time and also ensure consistency in the design of your workflow and charts. Numerous Gantt chart based project management tools, like Zace, support built-in and customizable templates, as per the different industries and projects available in them.
Advantage of Gantt chart Template
Gantt Chart Templates are invaluable tools that streamline the process of creating Gantt charts by providing a structured framework. This is predominantly why, Gantt charts are used in industries where multiple tasks are involved in multiple and complex projects.
. Quick Start: Templates eliminate the need to create a Gantt chart from scratch, saving significant time.
. Pre-Defined Structure: Templates come with pre-defined task categories, durations, and dependencies, reducing manual input time.
. Uniformity: Ensures consistency in chart design and formatting across projects or within a team.
. Standardization: Adhering to a template standardizes project management practices, making it easier for team members to understand and follow.
. User-Friendly: Templates are often designed to be user-friendly, allowing even those with basic project management knowledge to create effective Gantt charts.
. Intuitive Layouts: Well-designed templates offer an intuitive layout that facilitates easy customization.
. Reduced Learning Time: Templates are particularly beneficial for those new to Gantt charts, minimizing the learning curve associated with creating complex project timelines.
. Guided Structure: Provides a guided structure, helping users understand the essential elements of a Gantt chart.
. Customization Options: Most templates are customizable, allowing users to adapt the chart to the specific needs and nuances of their projects.
. Scalability: Templates can be scaled up or down based on the size and complexity of the project.
. Enhanced Communication: Facilitates clear communication by presenting project timelines and dependencies in a visually appealing and easily understandable format.
. Effective Reporting: Visual representations help stakeholders quickly grasp project progress, milestones, and potential bottlenecks.
. Task Breakdown: Templates often include sections for task breakdowns, making it easier to list and organize project activities.
. Record Keeping: Templates serve as documentation tools, providing a historical record of project timelines and milestones.
. Remote Work Support: In virtual or remote work settings, templates serve as a central source of project information.
Zace Gantt Chart with their Templates are versatile tools that enhance efficiency, consistency, and communication in project management. Whether you’re a seasoned project manager or a novice, leveraging Zace can significantly contribute to successful project planning and execution. Try out Zace for FREE and see for yourself!