It’s a corporate world of projects, regardless of which industry you belong to. And there’s a whole lot more, everyone is concerned about : Budget, Project Delay, Team Performance, Client Satisfaction, Transparent Communication, Perfect Collaboration, Timeline, Deadline, Improved Productivity, and Business Growth…to name a few.
What if there’s one tool that will let you live free of all those concerns? One tool that helps you visualize time, and resource management of a project, through out its timeline. One tool that helps you visualize clearly the path of the project, along with progress and performance. That’s precisely what Gantt chart does and that’s exactly why project managers, team leaders, and management are highly obsessed with Gantt Charts.
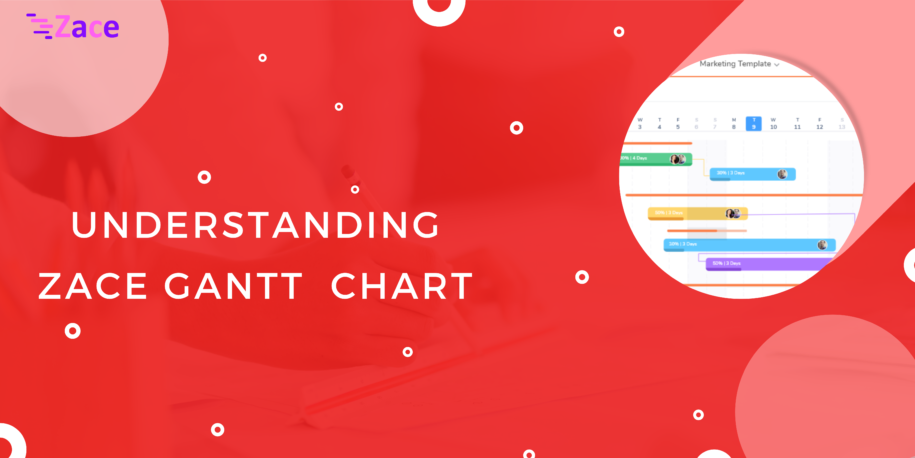
Zace Gantt Chart
Zace is a Gantt chart based Project Planner and Project Management App that supports you to plan, schedule, track, and manage projects, with the support of Gantt chart.
Zace project planning and project management app helps project managers to visualize projects in a Gantt chart view, organize and schedule tasks and subtasks, manage resources, keep track of the progress, and manage projects effectively.
Regardless of which industry you belong to, no matter how simple, small, big or complex your project is, whether it’s one or many projects at a time, even to an untrained eye, using Gantt chart and effectively managing projects is a piece of cake, with Zace.
And this post is to guide you on how to use Zace Gantt Chart.
How to read Zace Gantt Chart?
With support from industry-leading experts’ expertise, Gantt chart based Zace app’s templates are designed and developed, to ease the work of project managers and save time.
For a person who is new to Gantt chart, or new to Project management apps, a Gantt chart and Zace might look like a maze inside an app. Zace Gantt chart templates are easier to understand and much easier to create and work.
There are 5 important inputs in Zace Gantt chart.
Project Menu Bar
Task
Sub-task
Dependencies
Milestone
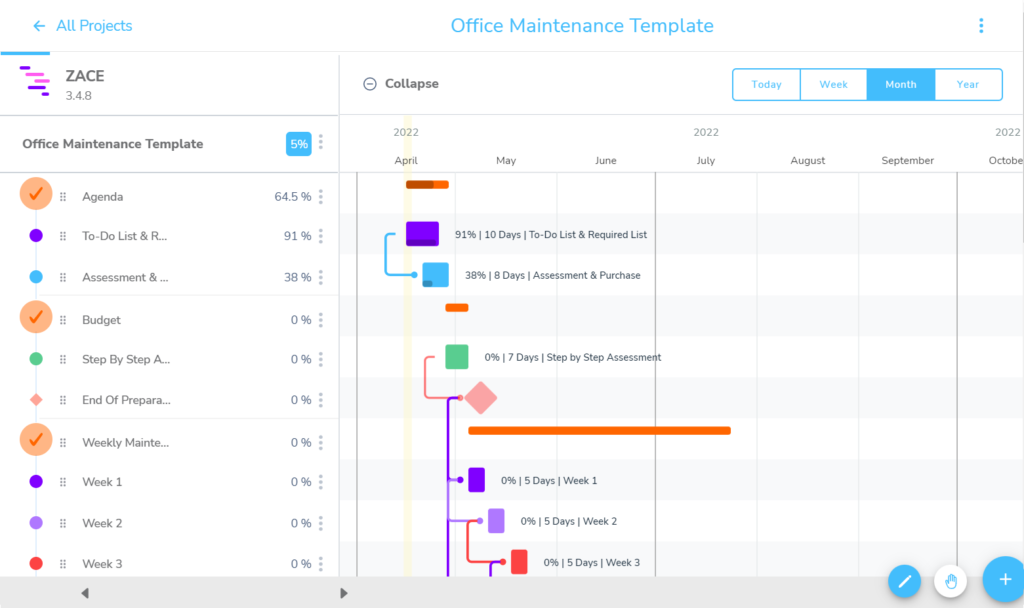
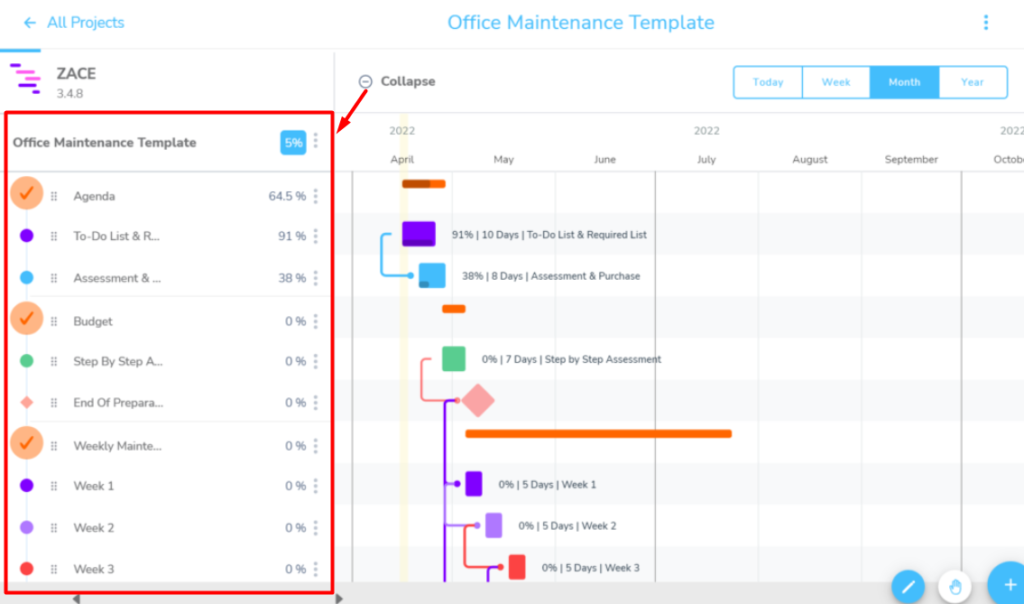
Project Menu Bar
A Side Menu pops on clicking the “+” near ‘Expand’, on the top -left corner of the screen.
The Project Menu Bar, represented in red rectangle box, shows the list of tasks and sub-tasks under the project. It also displays the individual task and sub-tasks’ progress in percentage.
The Project Menu Bar can be collapsed to get a full Gantt chart view, on the click of “-” near ‘Collapse’.
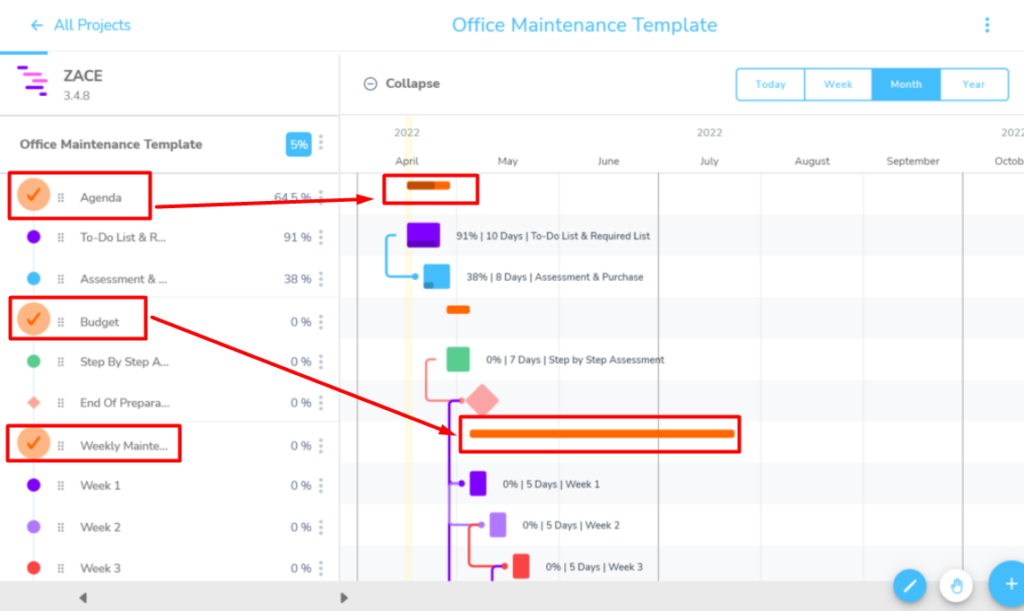
Task
Breaking a project into doable tasks ensures interest and prevents burnout among team members.
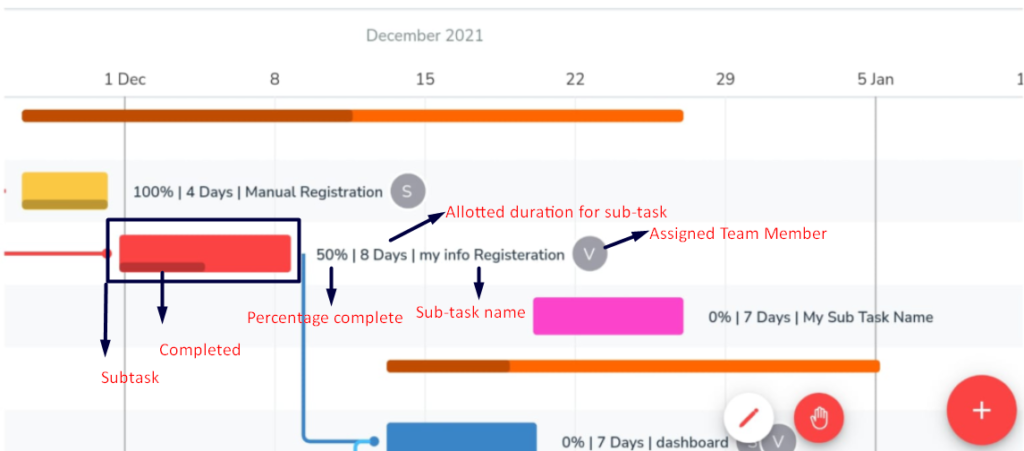
In Zace, the fields marked in red rectangle represent a Task. In Gantt chart, the rectangle bar without name represents an individual task. This helps in easy visual understanding on the categorization of project.
The Project Menu Bar shows the name of the task. The difference in color of task bar in Gantt chart represents the task completion and progress.
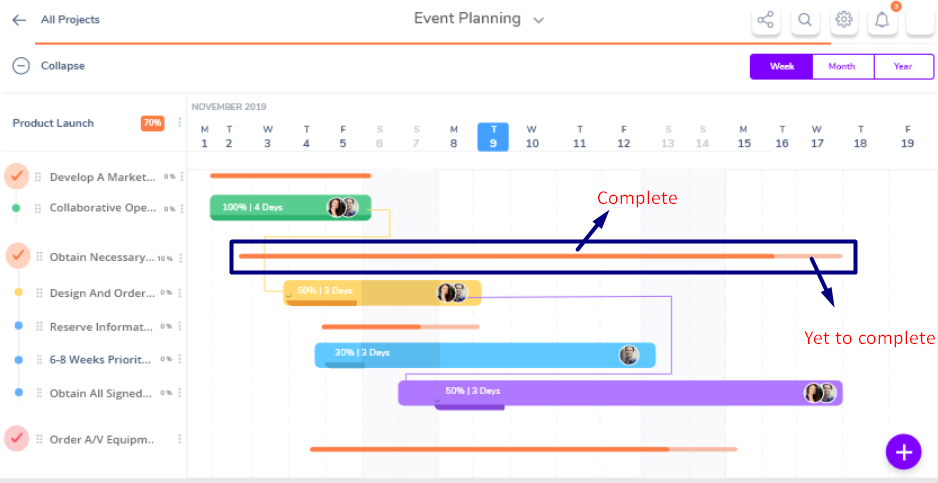
Sub-task
A sub-task in Zace Gantt chart represents breaking of a project’s task into manageable chunks.
The length of the sub-task, like the task, represents the timeline of the sub-task. The sub-task bar displays the percentage the sub-task is completed, total time allotted for the sub-task, and the sub-task name. It also shows the team members to whom the sub-task is assigned.
Any number of sub-task can be added under a task and be assigned to any number of team members.
On 100% completion of a sub-task, the corresponding task’s progress bar updates automatically. With 100% completion of all sub-tasks in a project, the progress bar of task updates to ‘completed’ automatically.
Dependency
‘Dependency’, defines the relationship among tasks and/or sub-tasks in a project. A dependency of a task means that, the particular task needs input from the task or sub-task it’s connected to. Only when the particular task or sub-task is completed, the task or sub-task connected with dependency can be started. This helps in completing the project in order. Setting out dependencies helps team members understand the sequence of task flow of a project.
Dependencies in Zace helps you to understand :
The order of the tasks.
Which task comes next and in turn allocate resource accordingly.
The flow of the task and project, in one-look.
Dependencies in Zace App :
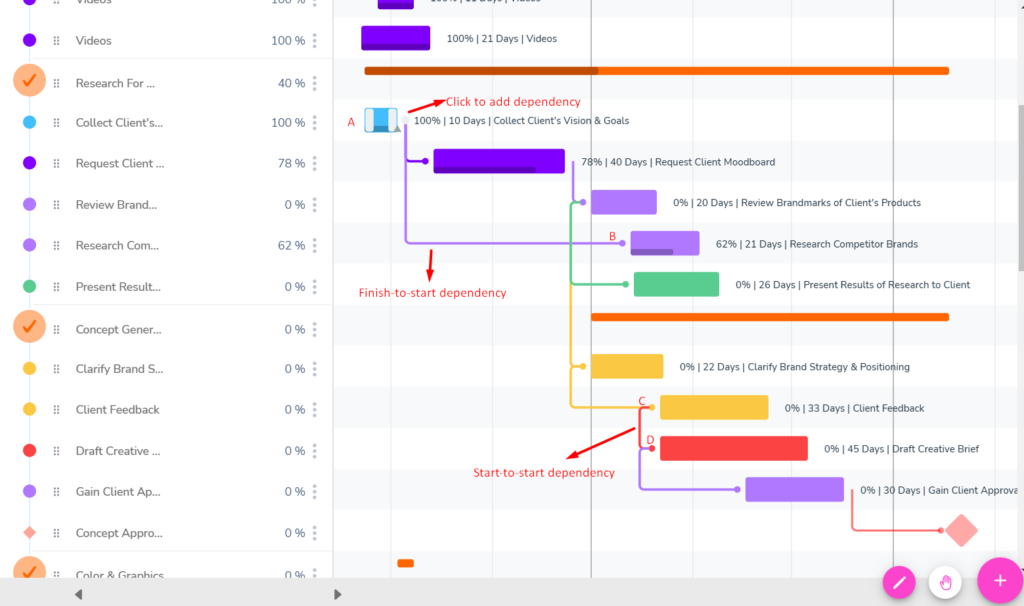
The lines in Zace Gantt chart represents ‘Dependencies’.
As mentioned above, only on completion of sub-task A, sub-task B can be started.
Also, sub-task D can be started only along with the starting of sub-task C.
Colorization of dependencies makes it easy to differentiate the dependencies in complex projects.
Any number of dependencies can be added to a task or sub-task.
Milestone
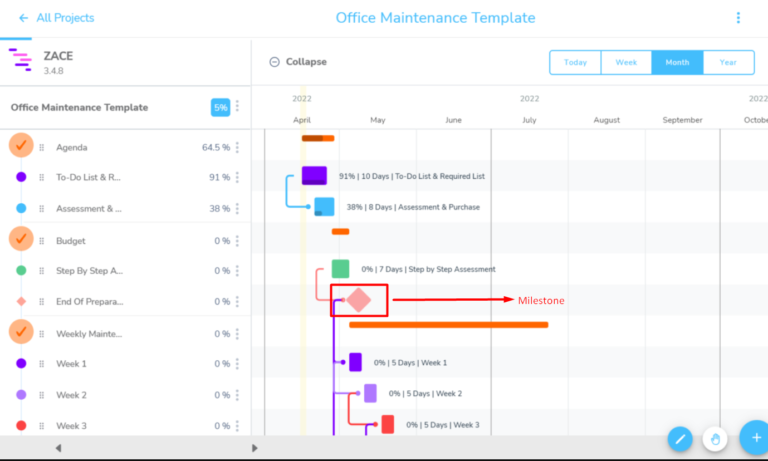
Milestones in Zace app represents a significant point or event of a project. It is used to define and demonstrate the progress of project.
A milestone can represent end of an important phase in the project, important deadlines, or external events. Dependency can be set to milestones in Zace.
In Zace, milestones helps to identify delays, track issues, and celebrate completion of a phase in project.
How does Zace Gantt Chart work?
Using Zace Gantt Chart app is easier to learn and use.
To start using Zace, all you need to do is, select the template which suits your project, edit details if needed (Tasks), and enter details (Assigned team member, set date, milestone, deadline, and add new subtasks). Once completed, you will have a visually easy to understand, color-coded Gantt chart view of the project.
All it takes is one more step to finish. Invite the team members and share the project flow with them, so they can easily understand the task assigned to them, dependencies of their task, and be prepared at the earliest possible.
With the start of the project, the project manager can invite clients and let them oversee the project’s progress.
Thus, everyone related to the project can stay updated as the workflow is automatically taken care of in one common platform. Everyone will be aware of the requirement, workload, and delays, be prepared of issues and foresee emergencies. Thus, with visually enriched, data filled Zace Gantt chart it is easier for everyone to understand and keep track of a project, regardless of size or how complex it is.
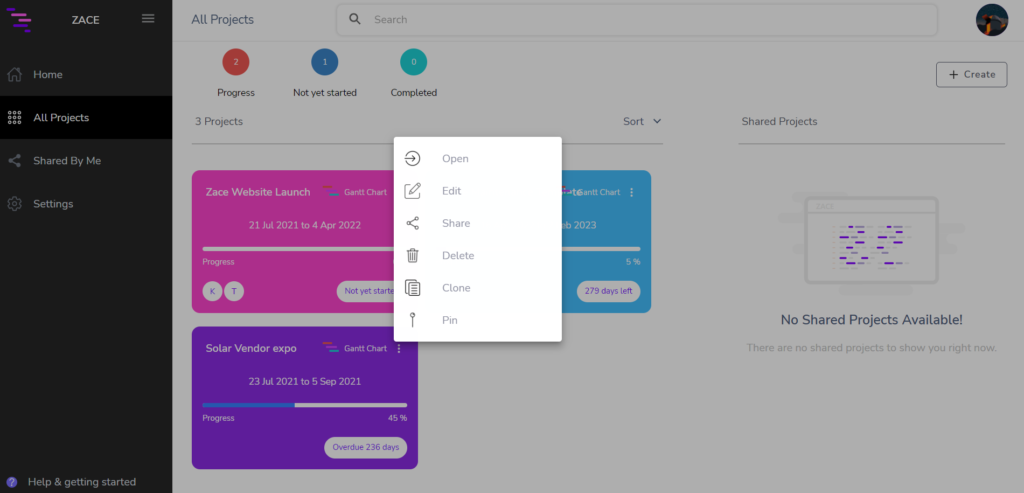
Managing multiple projects for a project manager is easy, as he/she will be able to view the projects’ performance through Zace.
Similarly, for a team member, multi-tasking is easier, as the team member can keep track of tasks assigned to him in different projects, under one platform, Zace.
Focusing on tasks and work is easier now with all the transparency, as every team member is on the same page, all the time. Zace Gantt chart makes it comfortable for members on the duration allotted for the task and corresponding sub-tasks to complete. It also helps a team member to track the dependent task or sub-task’s status, in order to start their assigned task or sub-task.
Are you using Zace for your project management?
Consider planning and managing projects using Zace.
With Zace, you will be amazed to find that project planning and project management was never this easy. Regardless of your industry, team size, project complexity, and location, Zace is best suited to meet all your project scheduling, tracking, and management related needs.
Gantt chart based Zace app helps in easy understanding or project, in one look, with its colorful visualization.
Zace App let’s you schedule, track, manage, update, and modify projects on-the-go, from your smartphone.
Zace Templates are the best time-saving tool for project planners wit its pre-defined tasks and sub-tasks.
Zace app is best to use when it comes to handling multiple projects .
Zace removes barriers and ensures collaboration, transparency, and communication.
Zace helps you in finishing projects before deadlines, at ease!
Ready to enjoy the benefits of managing projects using Zace?
Leave a Reply